Fibonacci Retracement Levels: An Introduction
Fibonacci Retracement Level is a technical analysis tool used in trading to identify potential levels of support and resistance. This tool is based on the famous Fibonacci sequence, a series of numbers in which each number is the sum of the two preceding numbers. This article will discuss the concept of Fibonacci retracement levels, how they are calculated, and how they are used in trading.
What are Fibonacci Retracement Levels?
Fibonacci retracement levels are horizontal lines on a price chart that indicate areas of support or resistance. These levels are calculated by using the Fibonacci sequence, which is a mathematical concept where each number is the sum of the two preceding numbers. The sequence starts with 0, 1, 1, 2, 3, 5, 8, 13, 21, 34, and so on.
The Fibonacci retracement levels used in trading are based on the percentage of a move in the price of an asset. The most commonly used retracement levels are 23.6%, 38.2%, 50%, 61.8%, and 100%. These levels are derived from the Fibonacci sequence by dividing one number by the next number in the sequence. For example, 38.2% is derived by dividing 21 (the eighth number in the sequence) by 55 (the tenth number in the sequence).
How are Fibonacci Retracement Levels Calculated?
To calculate Fibonacci retracement levels, traders first identify a high and a low point in the price of an asset. The high and low points can be identified in any timeframe, such as a daily, weekly, or monthly chart. Once the high and low points are identified, the trader draws a horizontal line from the high point to the low point.
The retracement levels are then calculated by multiplying the distance between the high and low points by the Fibonacci ratios of 23.6%, 38.2%, 50%, 61.8%, and 100%. These ratios are then added to the low point to determine the retracement levels. For example, if the high point is $100 and the low point is $50, the distance between the high and low points is $50. To calculate the 38.2% retracement level, the trader multiplies $50 by 0.382 (the Fibonacci ratio) to get $19.10. This is then added to the low point of $50 to get a retracement level of $69.10.
How are Fibonacci Retracement Levels Used in Trading?
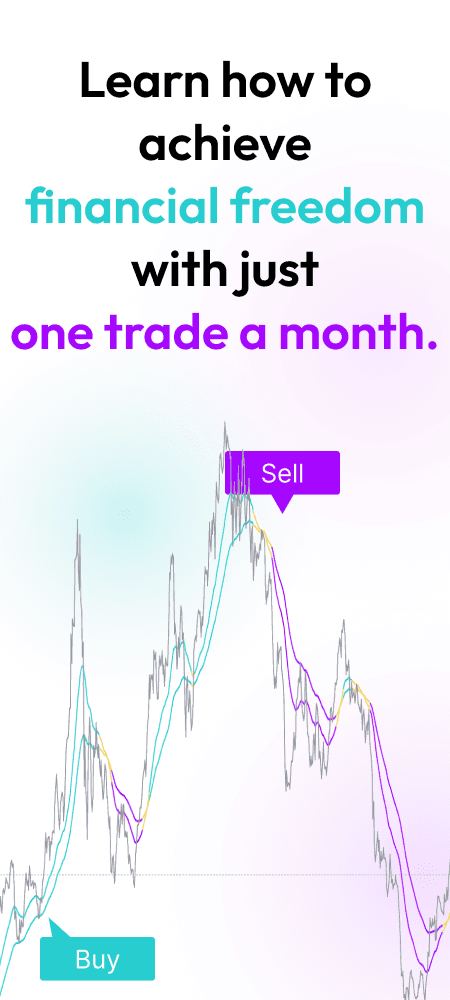
Fibonacci retracement levels are used in trading to identify potential areas of support and resistance. When the price of an asset is in an uptrend, traders will look for potential areas of support at the Fibonacci retracement levels. When the price of an asset is in a downtrend, traders will look for potential areas of resistance at the Fibonacci retracement levels.
Traders can also use Fibonacci retracement levels to determine entry and exit points for trades. For example, if the price of an asset is in an uptrend and has retraced to the 38.2% Fibonacci retracement level, a trader may consider entering a long position. The trader would then set a stop-loss order below the 50% retracement level in case the price continues to fall.
Fibonacci retracement levels can also be used in conjunction with other technical analysis tools, such as moving averages and trend lines, to confirm potential support and resistance levels.
Limitations of Fibonacci Retracement Levels
While Fibonacci retracement levels can be a useful tool in trading, they are not always accurate. Market conditions can change quickly, and prices can move in unexpected ways, making it difficult to rely solely on Fibonacci retracement levels for trading decisions.
Additionally, Fibonacci retracement levels are not foolproof indicators of future price movements. Traders must always use multiple indicators and analysis techniques to make informed decisions.
Another limitation of Fibonacci retracement levels is that they are based on historical data, which may not always be a reliable predictor of future trends. In rapidly changing markets, historical data may not provide an accurate representation of current market conditions.
Furthermore, Fibonacci retracement levels do not take into account external factors that may impact price movements. These factors can include geopolitical events, economic indicators, and news announcements that can cause sudden price changes.
Conclusion
Fibonacci retracement levels are a popular tool used by traders in the crypto, blockchain, and finance industries to identify potential support and resistance levels. By using these levels in combination with other technical analysis techniques, traders can make informed decisions about buying and selling cryptocurrencies and other financial instruments.
However, it is important to note that Fibonacci retracement levels are not always accurate and should not be relied on exclusively. Traders must also consider market conditions, and external factors, and use multiple analysis techniques to make informed trading decisions.
Overall, Fibonacci retracement levels can be a valuable addition to any trader's toolkit but should be used in conjunction with other analysis methods and strategies for the most effective trading results.