Moving Average (MA) in Trading
Moving Average (MA) is a popular technical analysis tool used in the field of finance and crypto trading. It is a widely used indicator that can help traders and investors understand the direction of a trend and identify potential buying and selling opportunities.
What is Moving Average (MA)?
Moving Average (MA) is a widely used technical analysis tool that smoothens out price action by averaging out the fluctuations over a given period of time. It is calculated by taking the average price of an asset over a specific period, and then plotting that average on a chart. This creates a line that moves along with the price action, and it is referred to as the moving average line.
Moving averages are used to identify the direction of a trend and to identify potential buying and selling opportunities. They can also be used to determine support and resistance levels.
Types of Moving Averages
There are three main types of moving averages: Simple Moving Average (SMA), Exponential Moving Average (EMA), and Weighted Moving Average (WMA).
Simple Moving Average (SMA)
The Simple Moving Average (SMA) is the most basic type of moving average. It is calculated by adding the closing prices of an asset for a specific number of periods and then dividing the sum by that number of periods. For example, a 20-day SMA is calculated by adding the closing prices of the last 20 days and dividing the sum by 20.
Exponential Moving Average (EMA)
The Exponential Moving Average (EMA) is similar to the SMA, but it places more weight on recent price action. It is calculated by giving more weight to the most recent closing prices in the calculation. This means that the EMA reacts more quickly to changes in price compared to the SMA.
Weighted Moving Average (WMA)
The Weighted Moving Average (WMA) is similar to the EMA, but it places more weight on the most recent price action. It is calculated by multiplying each closing price by a weight, which is determined by the number of periods being used. The sum of the weighted prices is then divided by the sum of the weights.
How to use Moving Averages in Trading
Moving Averages are a popular tool among traders and investors in the crypto and blockchain space. Here are some ways they can be used:
Identifying Trends
Moving averages are often used to identify the direction of a trend. When the price is above the moving average, it is considered to be in an uptrend, and when the price is below the moving average, it is considered to be in a downtrend.
Traders can use moving averages of different time periods to confirm trends. For example, a trader might use a 20-day and 50-day moving average. If the 20-day moving average is above the 50-day moving average, it is considered a bullish signal, and if the 20-day moving average is below the 50-day moving average, it is considered a bearish signal.
Identifying Support and Resistance Levels
Moving averages can also be used to identify support and resistance levels. When the price is above the moving average, the moving average can act as a support level, and when the price is below the moving average, it can act as a resistance level.
Trading Strategies
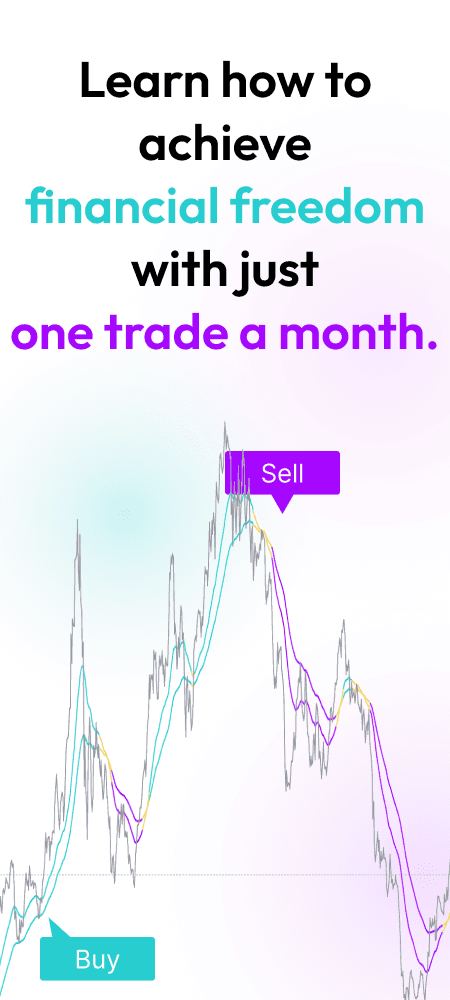
Moving averages can also be used to develop trading strategies. One common strategy is to buy when the price crosses above the moving average and sell when the price crosses below the moving average.
Another strategy is to use two moving averages of different time periods, such as 20-day and 50-day moving averages.
Traders often use two moving averages of different time periods to identify trading signals. This strategy is called a "crossover" strategy.
When a shorter-term moving average, such as the 20-day moving average, crosses above a longer-term moving average, such as the 50-day moving average, it is considered a bullish signal. On the other hand, when a shorter-term moving average crosses below a longer-term moving average, it is considered a bearish signal.
The idea behind this strategy is that when the shorter-term moving average crosses above the longer-term moving average, it indicates that the recent trend is starting to gain strength and there may be an opportunity to buy. Conversely, when the shorter-term moving average crosses below the longer-term moving average, it indicates that the recent trend is starting to weaken and there may be an opportunity to sell.
It's worth noting that while moving averages can be effective tools for identifying trends and potential trading signals, they should not be relied upon in isolation. It's important to use other technical analysis tools and consider other factors, such as market news and events, before making trading decisions.
In conclusion, moving averages are a popular and widely used technical analysis tool in the world of finance and cryptocurrency trading. By smoothing out price data over a specific time period, moving averages can help traders identify trends, potential support and resistance levels, and potential trading signals. Whether used alone or in combination with other technical analysis tools, moving averages can be a valuable addition to any trader's toolbox.